
If you’ve been trying to make sense of the Canadian real estate market lately, you’re not alone.
Some cities are cooling off, others are holding strong, and a few are starting to heat back up when no one’s really expecting it. It’s one of those times where you can’t just look at the headlines — you’ve got to look a little closer at what’s happening on the ground, city by city.
WOWA just dropped their latest national update for May, and it does a solid job breaking down where things are heading right now. With interest rates slowly trending down and inventory shifting across the board, there are definitely a few things worth paying attention to — especially if you’re buying, selling, or investing this year.
We went through the report and pulled out what actually matters so you can get a clearer picture of what’s going on — and maybe spot where the real opportunities are starting to show up.
Let’s take a look at what’s happening across the major markets.
Canada
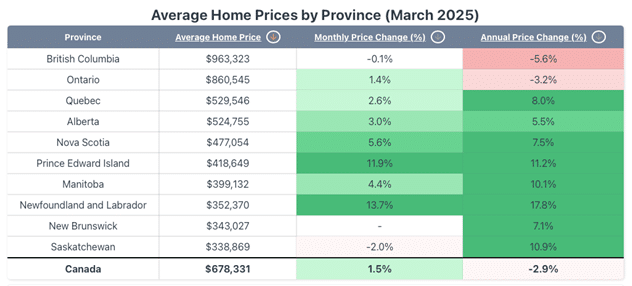
Canada’s national average home price increased to $678,331 in March 2025, marking a 1.5% increase from February 2025’s $668,097. On an annual basis, it’s down 2.9% compared to March 2024. Seasonally adjusted sales activity totalled 35,517 transactions in March 2025, showing a decline of 4.0% from February 2025 and a 7.7% decrease year-over-year.
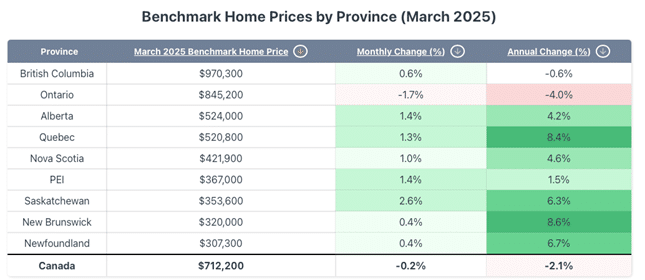
The national benchmark home price, which measures the price of a “typical” home, was $712,200, showing a 0.2% decrease month-over-month and a 2.1% decrease year-over-year.

Nationally, home sales reached 35,517 in March 2025, a seasonally adjusted 4.0% decrease from the previous month. The Canadian Real Estate Association (CREA) noted that home sales continued to decline due to the impacts and uncertainty surrounding U.S. tariffs.
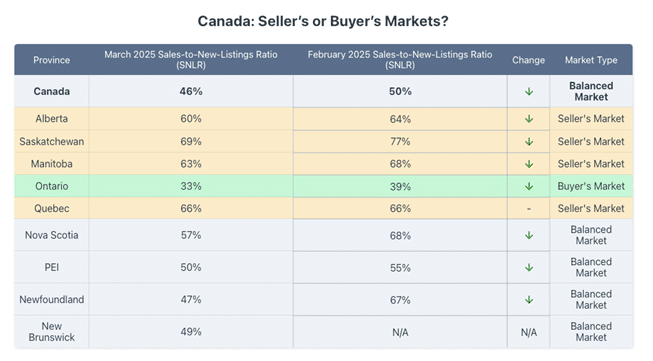
The sales-to-new-listings ratio (SNLR) stood at 46%, down from 50% in February 2025, suggesting a shift toward a softer market.
The decline in home sales year-over-year comes despite the Bank of Canada’s successive rate cuts that began in June 2024. While these easing measures were aimed at stimulating economic growth by reducing borrowing costs and lowering mortgage rates, their positive impact on buyer activity appears to be waning. Economic uncertainty and affordability challenges continue to act as significant counterbalances to the stimulative effects of lower interest rates.
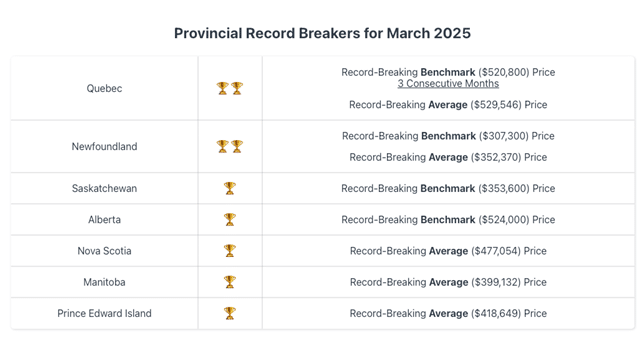
Multiple provinces achieved record-breaking home prices in March 2025, with four provinces breaking their all-time benchmark price records and five breaking their average home price records. Alberta, Nova Scotia, Newfoundland, Quebec, Manitoba, Saskatchewan, and PEI all set new all-time highs in March 2025. Notably, Newfoundland’s average home price showed the largest year-over-year increase at 17.8%. The only provinces that did not break an all-time price record this month were Ontario, British Columbia, and New Brunswick.
Benchmark Prices Across Canada
Canada Market Condition
Balanced
This Month’s SNLR: 46%
An SNLR between 40% and 60% indicates a balanced market.
For March 2025, benchmark home prices showed mixed annual performance across provinces. While most provinces continue to see year-over-year growth, Ontario and British Columbia remain in negative territory. British Columbia’s benchmark price is down 0.6% compared to March 2024, while Ontario’s benchmark is down 4.0% year-over-year. These declines contribute to the national benchmark price being down 2.1% compared to the previous year.
All other provinces are seeing year-over-year increases in their benchmark home prices, with Saskatchewan’s benchmark price increasing 6.3% to $353,600, Quebec up 8.4% to $520,800, and New Brunswick up 8.6% to $320,000. Newfoundland’s benchmark price is up 6.7% annually at $307,300.
Sales To New Listing Ratio – (SNLR)
For March 2025, Canada’s sales-to-new-listings ratio (SNLR) decreased to 46% from 50% in February 2025, maintaining its status as a balanced market but heading toward buyer’s market territory. This indicates that, on the national level, the equilibrium between supply and demand continues to allow sellers to receive reasonable offers while providing buyers with adequate choices.
An SNLR above 60% suggests a seller’s market characterized by limited buyer options and higher competitiveness. An SNLR below 40% signals a buyer’s market, indicating plentiful listings and increased buyer leverage. An SNLR between 40% and 60% represents a balanced market.
Several of Canada’s provincial housing markets have seen significant shifts in their market conditions for March 2025. Most provinces experienced decreases in their SNLRs compared to February 2025. Saskatchewan (69%), Alberta (60%), Manitoba (63%), and Quebec (66%) remain firmly in seller’s market territory. These provinces also broke all-time price records this month. Newfoundland has shifted to a balanced market with an SNLR of 47%, down significantly from 67% in February 2025. Nova Scotia (57%), PEI (50%), and New Brunswick (49%) also sit in balanced market territory.
Ontario
Ontario’s housing market had an average home price of $860,545 in March 2025, up 1.4% from February’s $848,289 but down 3.2% year-over-year.
The average home sold price in the GTA was $1,093,254 in March 2025, representing a decrease of 2.5% year-over-year and up by 0.8% month-over-month. Meanwhile, the GTA’s benchmark home price is down 3.8% year-over-year to $1,068,500.
GTA home sales are down 24% year-over-year, with 5,011 transactions in March 2025. The GTA’s SNLR was 29%, in buyer’s market territory.
Ottawa’s housing market saw prices increase 2.9% year-over-year to $669,945 in March 2025, while cities like the Hamilton housing market and London housing market are seeing slight decreases year-over-year.
Ontario Market Condition
Buyer’s Market
This Month’s SNLR: 33%
An SNLR below 40% indicates a market that favours buyers.
British Columbia
British Columbia’s housing market saw a minor decrease in March 2025, with average prices falling 0.1% month-over-month to $963,323. However, on an annual basis, prices remain down 5.6% compared to March 2024. Sales activity was at 5,917 transactions, up 19.6% from February 2025, though still down 9.6% compared to the previous year. Greater Vancouver’s average home price for March 2025 was $1,239,418, down 5.9% year-over-year.
Quebec
Quebec’s average home price was $529,546 in March 2025, breaking an all-time high. It is up 2.6% from February’s $515,899 and 8.0% higher than the previous year. The province saw 9,741 sales in March, up 14.7% from February 2025, while being up 9.2% from the previous year. Quebec City specifically showed a slight decrease with average prices at $444,510 (down 0.4% month-over-month but up 14.3% year-over-year). The Montreal housing market saw its average home price rise 5% annually to an average price of $625,026 for March 2025.
Quebec Market Condition
Seller’s Market
This Month’s SNLR: 66%
An SNLR above 60% indicates a market that favour sellers.
Atlantic Canada
Nova Scotia
Nova Scotia’s housing market had an all-time high average home price of $477,054 in March 2025, a significant 5.6% increase from February 2025’s $451,969 and up 7.5% from the previous year. Halifax’s average home price was $601,250, showing a 1.8% monthly increase and maintaining a 6.5% annual increase. Sales activity across Nova Scotia increased by 20.2% month-over-month and 4.5% year-over-year, while Halifax specifically saw a 24.2% increase in transactions compared to February 2025.
Nova Scotia Market Condition
Balanced
This Month’s SNLR: 57%
An SNLR between 40% and 60% indicates a balanced market.
New Brunswick
New Brunswick’s average home price in March 2025 was $343,027, up 7.1% year-over-year yet down slightly from February 2025’s record-breaking price. New Brunswick saw a slight 2.3% decrease in sales year-over-year. The only other provinces to see year-over-year declines in sales this month are BC, Alberta, and Ontario. Looking at the average home price in New Brunswick’s major cities, Fredericton is at $358,274 (up 1.6% month-over-month and 4.4% year-over-year), Moncton at $380,010 (up 4.3% month-over-month and 5.4% year-over-year), and Saint John at $357,636 (down 10.6% month-over-month but up 9.5% year-over-year).
Prince Edward Island
Prince Edward Island’s average home price was $418,649 in March 2025, an all-time high and a significant 11.9% increase from February’s $373,993 and up 11.2% from the previous year. The province recorded 160 sales, up 27.0% from February 2025 and 13.5% year-over-year. With an SNLR of 50% (down from 55% in February), the market remains in balanced territory.
Newfoundland and Labrador
Newfoundland and Labrador’s housing market experienced a remarkable increase in March 2025, with an average home price of $352,370, representing a 13.7% increase from February 2025’s $309,844 and 17.8% higher than the previous year. This is an all-time high and marks a significant recovery from February 2025’s flat annual performance. Sales activity remained stable with 339 transactions, down 0.3% from February 2025 but up 9.7% year-over-year.
The market has shifted from seller’s territory to a more balanced market with an SNLR of 47%, down significantly from 67% in February 2025.
The Prairies
Alberta
Alberta’s average home price increased to $524,755 in March 2025, up 3.0% from February 2025’s $509,468 and 5.5% year-over-year. The province continues to show consistent price growth, with March setting a new record high benchmark price. Sales activity reached 6,894 transactions, up a substantial 32.0% from February, though down 7.0% year-over-year. With an SNLR of 60% (down from 64% in February 2025), Alberta remains at the edge in seller’s market territory, indicating strong demand relative to available supply.
Meanwhile, looking at Alberta’s major cities, average home prices in Calgary are up 7.3% year-over-year to $639,458, while Edmonton home prices had a 9.4% annual increase to $460,685.
Alberta Market Condition
Seller’s Market
This Month’s SNLR: 60%
An SNLR above 60% indicates a market that favour sellers.
Saskatchewan
The average home price in Saskatchewan decreased to $338,869 in March 2025, down 2.0% from February 2025’s record-breaking $345,688 but up 10.9% from March 2024. Instead, Saskatchewan’s benchmark home price broke an all-time record this month. The province recorded 1,277 sales in March 2025, up 29.5% from February 2025 and up 8.0% from the previous year.
Saskatoon’s average home price reached $399,742 in March 2025, down 6.9% from February but up 6.0% year-over-year. Regina’s average home price rose to $344,451, up 4.2% from February and up 17.0% year-over-year. Both cities saw sales increases year-over-year, with Saskatoon up 12% and Regina up 4% from March 2024 levels.
Manitoba
Manitoba’s average home price in March 2025 was $399,132, a significant increase of 4.4% from February 2025 and up 10.1% year-over-year for an all-time high. This represents continued strength in the provincial market, with Manitoba now showing one of the more robust annual price gains among the provinces. Sales activity reached 1,251 transactions, up 32.5% from February 2025 and up 5.3% compared to March 2024. Winnipeg’s average home price of $402,915 in March 2025 is up 7.3% year-over-year.